By:
Doug Sherman, Field Sales Applications Engineering Manager,
Dr. Oscar Montero, Market Segment Tech Manager,
Paul Bachman, Fellow Engineer/Marketing Director
Crydom, Inc.
Introduction
Power switching solutions are widely used on heating, lighting and motor applications where frequent switching is required in order to perform a given task. A switching solution can be considered as one that matches load and electric supply characteristics and addresses performance, integration, environmental, life expectancy and cost constraints among others.
Engineers, Supply Chain Managers, Marketing and Business Development Managers are often concerned about a variety of costs accruing over the entire life cycle of the equipment where the switching solution is implemented. Eventually, known and hidden costs will show up to negatively impact the profitability of the business if they are not fully accounted for.
Fig. 1 shows three costs associated with a switching solution at different times. “Sampling cost” could be related to the purchase cost of a small quantity of the switching solution under consideration plus the lead time to obtain such samples for prototyping and trade off studies. “Procurement cost” is thought of as the initial purchase cost of a chosen switching solution after negotiations involving forecast and contractual terms. “Warranty cost” may occurduring the last and longest phase of the life cycle and are highly dependent of the business model implemented for each company. More details about costs and how to account for them are presented in subsequent sections leading to a new paradigm where Solid State Relays may be considered more cost effective than other switching solutions.
 Fig. 1 - Product life cycle showing important costs for switching solutions
Solid State Relays are "Faster – (More) Cost Effective - Better"
When considering switching solutions, traditional choices for Engineers and Supply Chain Managers are Solid State and Electromechanical technologies. Solid State being a more recent technology is frequently compared to electromechanical in almost every aspect. It is interesting to see that Engineers tend to focus mostly on performance while Supply Chain Managers are more concerned about initial cost of the parts and delivery times. Marketing and Business Managers tend to lean toward life expectancy and associated maintenance costs. Sometimes it is hard to say which cost is more important or weighs more, but at the end a decision has to be made and a switching solution has to be chosen. Over time, the benefits of the solid state switching technology have been better understood and leveraged to address more demanding requirements of new applications placing particular emphasis on performance and cost. To understand the “Faster-Better” sides of the motto, the benefits of using SSRs are briefly described in the Solid State & Contactors Handout available in the Brochures page.
For some users the belief has been that Solid State Relays (SSRs) and Solid State Contactors (SSCs) are preferred over other switching technologies for only one or two of the attributes of the motto, but not all three. This document presents a complementary view focused on the “Cost Effective” aspect of SSRs and SSCs.
Rather than focusing only on initial cost, the approach presented here is more toward considering the life cycle of the switching solution as depicted on Fig. 1, where life expectancy is one key feature of SSRs and SSCs. Furthermore, the document includes a guide to look at different cost categories that should help to uncover hidden costs of the switching solution. This guide can ultimately be converted into a calculator where “Cost Effective” can be expressed quantitatively. All along, the purpose of this document is to assist potential users or buyers to reduce cost and enhance performance throughout the life cycle of their preferred switching application.
Considerations & Assumptions
Open and closing an electric circuit by activating a switch has evolved from being a simple task where features such as high speed control, reliability and compatibility with control systems are now part of the requirements. These requirements are closely tied to costs which relate, among others, to availability of products (stock), down time (failures), differentiation (competitors), and repair & replacement (manpower and material).
In terms of life expectancy, SSRs are known to last for millions of operations while other competing technologies such as EMRs are known to last in the range of 100K-500K operations or slightly above when heavily derated. Obviously, the life expectancy of EMRs depends on the quality of materials and can be further increased at an additional cost. A common practice to increase life expectancy of EMRs is oversizing the ratings of the contacts which in turn increases cost of the part as well. Furthermore, EMR users should be aware that life expectancy is significantly reduced if the electric load is inductive in nature. In other words, life expectancy is reduced when driving a motor. As opposed to EMRs, life expectancy for SSRs is not compromised by the nature of the load as there are no moving parts or electric arcs present during its operation.
The initial cost of the switching solution is highly regarded by everyone and should be put in context by looking into how much, either in money or percentage, the switching solution accounts for when compared to the total cost of the equipment where it is installed. An SSR could cost more than twice that of an EMR. In this context, however, one could, for example represent 1.5% and the other 1.6% of the total cost of the equipment. Even more, it could be that the contribution to the total material cost by the switching solution does not match the impact of having a failing part. In some cases it is hard to understand the approach of trying to save a few cents on a switching solution for equipment that costs in the range of thousands that will eventually be stopped if the switching solution fails for some reason, such as "end of life".
| Cost categories | Cost elements | Initial | 100K cycles | 200K cycles | 5M cycles |
|---|
| Technology | SSR | $$ |
|
|
|
| Wiring | $ |
|
|
|
| Mounting | $ |
|
|
|
| Manpower | $$$ |
|
|
|
| On-going / operational | Repair & Replace | NA | NA | NA | NA |
| Manpower | NA | NA | NA | NA |
| Others | Down time | NA | NA | NA | NA |
| Stock for R & R | NA | NA | NA | NA |
| Travel | NA | NA | NA | NA |
Table 1 - Total Cost of Ownership template
In reality, costs associated with a switching solution can be grouped into different categories as suggested in Fig. 1. A second approach is shown in Table 1 where Technology costs are related to the initial cost of the product plus costs of installing and commissioning the part such as wiring and mounting. The cost of a heat sink may have to be considered for an SSR, as well as the cost of a socket for an EMR. On-going or Operational costs pertain to regular activities and components needed to keep the switching solution operating properly. Here, repair & replace costs are the most common of all. The last category labeled as Others, is intended to accommodate diverse costs that can be associated to down time of equipment, the lead time to receive spare parts, the repair & replace response time, impact on company‟s image, impact on supplier rating, etc.
At this point, it should be clear that the importance, cost and applicability of some elements in Table 1 change from application to application and could be largely affected by the number of switches installed on the equipment, the total cost of the equipment or the impact created by the switch failing to operate.
A third approach to analyze costs is by grouping them into Direct and Indirect costs. Life cycle of the solution should be the reference frame regardless of the approach taken to analyze costs.
Total Cost of Ownership Calculator
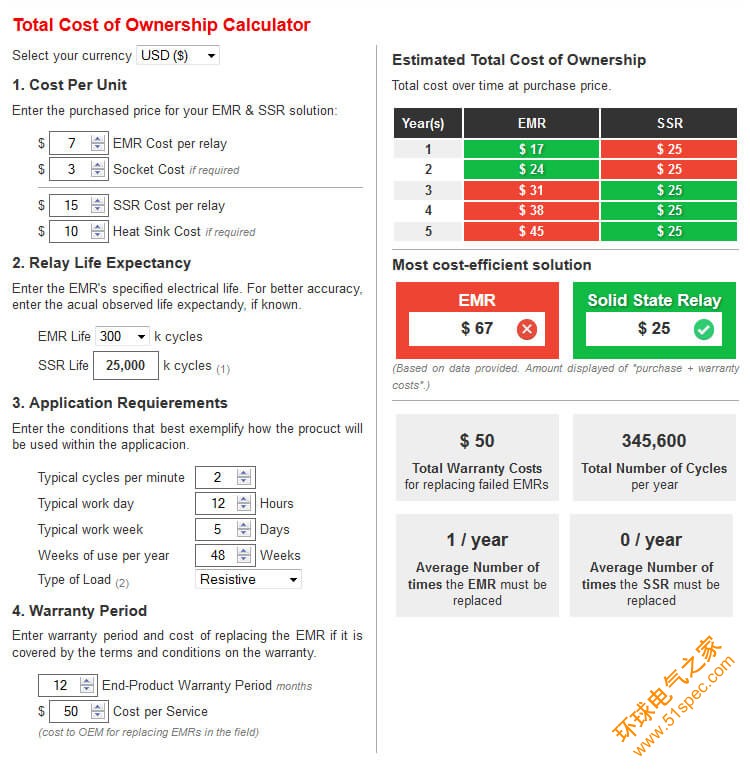
A user friendly TCO Calculator is available based on some items described in Table 1. A screen snapshot is presented in Fig. 2. The calculator includes a side by side comparison for an SSR and an EMR. It considers information related to cost either directly or indirectly and also assumes that both switching solutions have been properly selected to match the load and the power system. A more detailed explanation is below.
 Fig. 2 – Total Cost of Ownership Calculator
In section 1, the calculator includes costs mainly associated to Technology as they are common among different applications. Cost per unit is the acquisition cost of the switching solution. As mentioned before, the SSR may require a heat sink while the EMR may require a socket. Notice that there could be situations where the heat sink is already built-in to the SSR or the EMR is installed without socket.
Section 2 accepts inputs for life expectancy of the switching solution. It is given in number of operations or cycles. Even though SSRs are well understood to last in excess of 100M operations, it is safe to use for the sake of the exercise, a conservative number of 25M operations under conditions disclosed on note 1 for a Crydom SSR. The life expectancy for EMRs should be obtained from manufacturer‟s datasheets and the number entered should correspond to resistive applications.
Application requirements in section 3 are application specific. In the absence of specific data it is suggested to use estimates based upon experience. Please keep in mind that SSRs can allow operation at substantially higher cycle rates per minute than EMRs. The type load is needed in order to make life expectancy adjustments for EMRs. Inductive loads imply reduced life for EMRs but do not have any impact on SSRs. A pull down menu allows choosing from three different groups of inductive loads with derating of 80% for motors, coils or solenoids, 75% for transformer primaries or capacitors and 70% for ballasts, versus resistive load life expectancy ratings.
The Warranty period in section 4 is used as a time reference when presenting the estimated results of the total cost. It can be adjusted to show different time frames such as 1 month, to one year or more. Cost per service is considered as another variable as it changes from application to application or from one business model to another.
Results presented on the right side of the screen are self-explanatory. It should be noted that the calculator considers only one unit of the switching solution for the sake of the exercise. An interesting challenge for users of EMRs is to expand this calculator to accommodate several relays on the estimation of the total cost.
Conclusions
This document touched on “Faster-Better” while focused on “Cost Effective” for SSRs from a life cycle perspective rather than the initial investment view.
Some important considerations have been presented in order to include all relevant costs that determine the Total Cost of Ownership of either an SSR or an EMR. Also, a simple calculator has been introduced as a tool to estimate costs for both switching technologies. It must be kept in mind that results may change from application to application as conditions and assumptions change accordingly.
In general, it can be said that for applications where frequent switching is required, SSRs exhibit superior performance at an effective cost.
For additional information on Solid State Relays with Motor Controller ratings, contact Technical Support.


 Fig. 1 - Product life cycle showing important costs for switching solutions
 Fig. 2 – Total Cost of Ownership Calculator